We use cookies
We use cookies and similar technologies to run the site, remember your preferences, and improve your experience. By choosing "Accept all", you allow optional cookies. You can change your mind anytime in our Cookie Policy.


Get clear market insights in 1 minute
AI-powered insights turn complex market data into clear market intelligence with real time data
Latest market news in seconds
From Market Snap to a full report and live AI coach
Pick the depth you need

Comprehensive Global Market Coverage
Our platform connects global stocks, forex, indices, commodities, and crypto with real-time market data
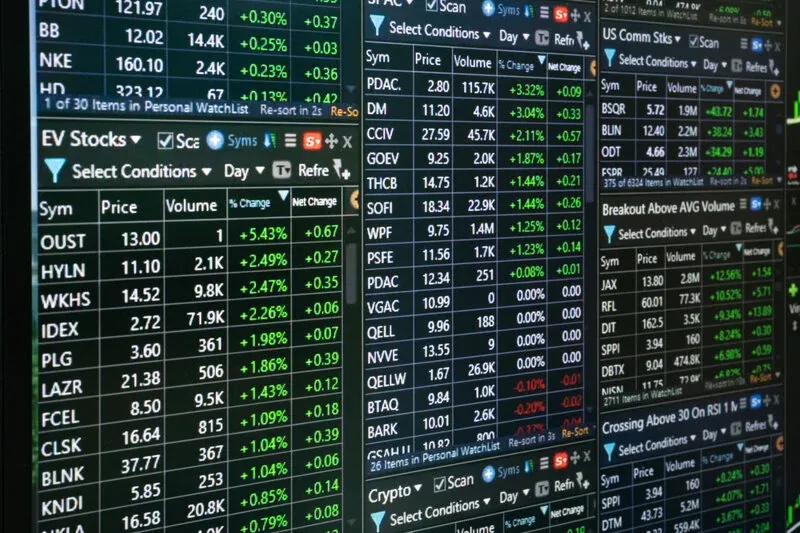
Global Stocks
US Stock, North America, Asia, Europe, Oceania, South America, Africa, Other Markets
Forex Currencies
major, minor, cross, exotic
Major Indices
US Indices, European Indices, Asian Indices
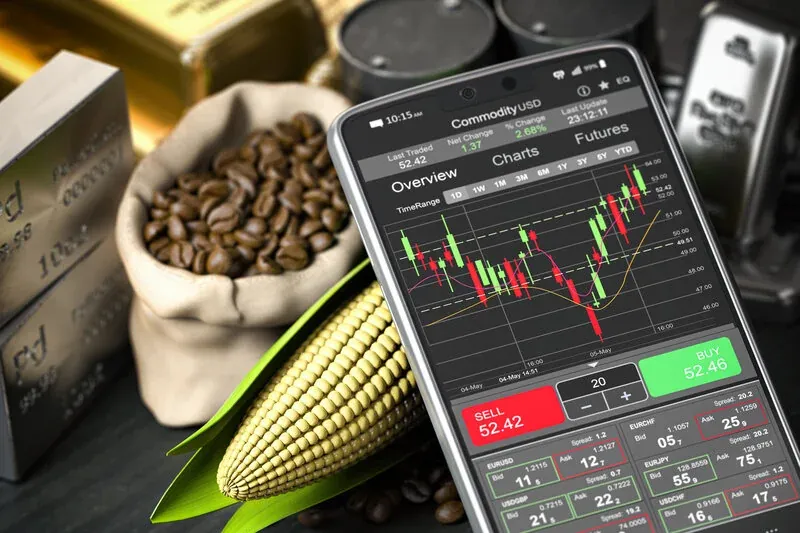
Commodities
Metals, Energy, Agriculture, Other

Cryptocurrencies
Major, Mid-Cap, Small-Cap, Others

Others
ETF, FUND, PORTFOLIO, TRUST, REIT, UCITS, INDEX
Analysis in a Click
Super simple: grab a quick snapshot or go deep with full AI research — you choose the depth that fits your style.
Quick View: Instant Market Snapshots
- One-click analysis from any market table
- AI-generated trend and momentum signals
- Key support and resistance levels at a glance
- Quick actionable trade ideas in seconds
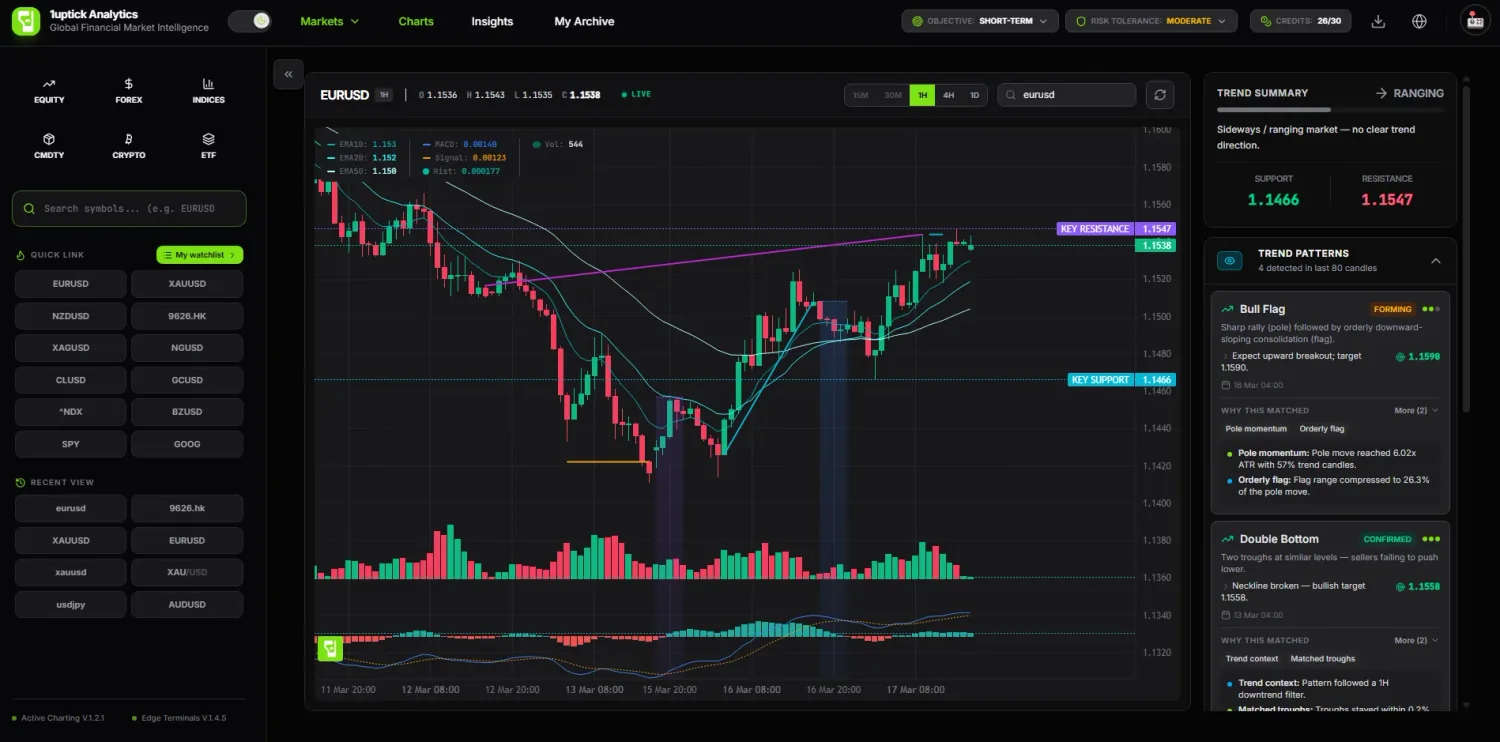
Pattern & Candlestick Detection
- Automatic chart pattern detection (head & shoulders, triangles, wedges)
- Real-time candlestick pattern recognition
- Pattern strength and reliability scoring
- Multi-timeframe pattern analysis
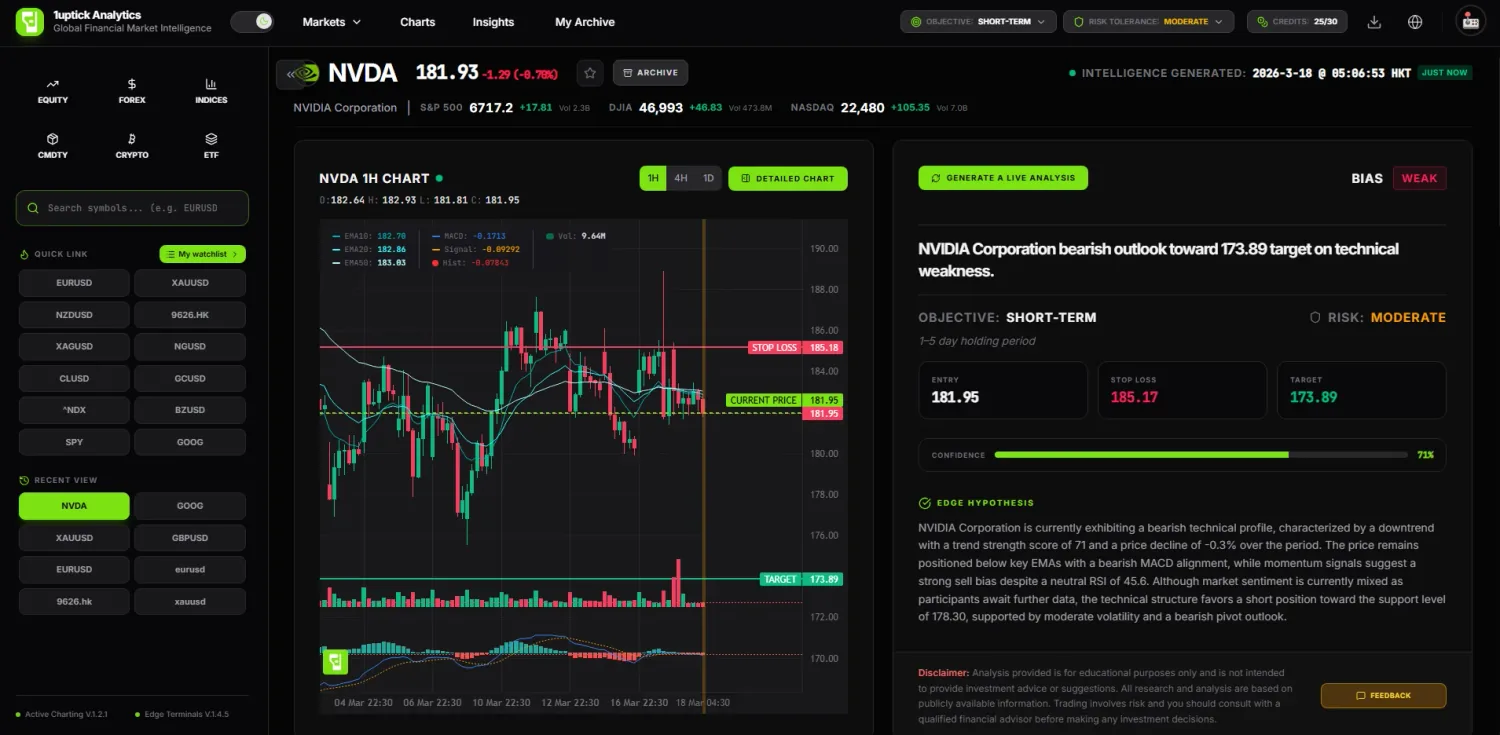
Edge Terminals: Deep Custom Analysis
- Category-optimized analysis engines
- Sector correlations and market context
- Deep fundamental and technical synthesis
- Personalized trade plans based on your strategy
Financial market analysis
Free, browser-based tools for investment research and market education—charting, heatmaps, economic calendar, and more
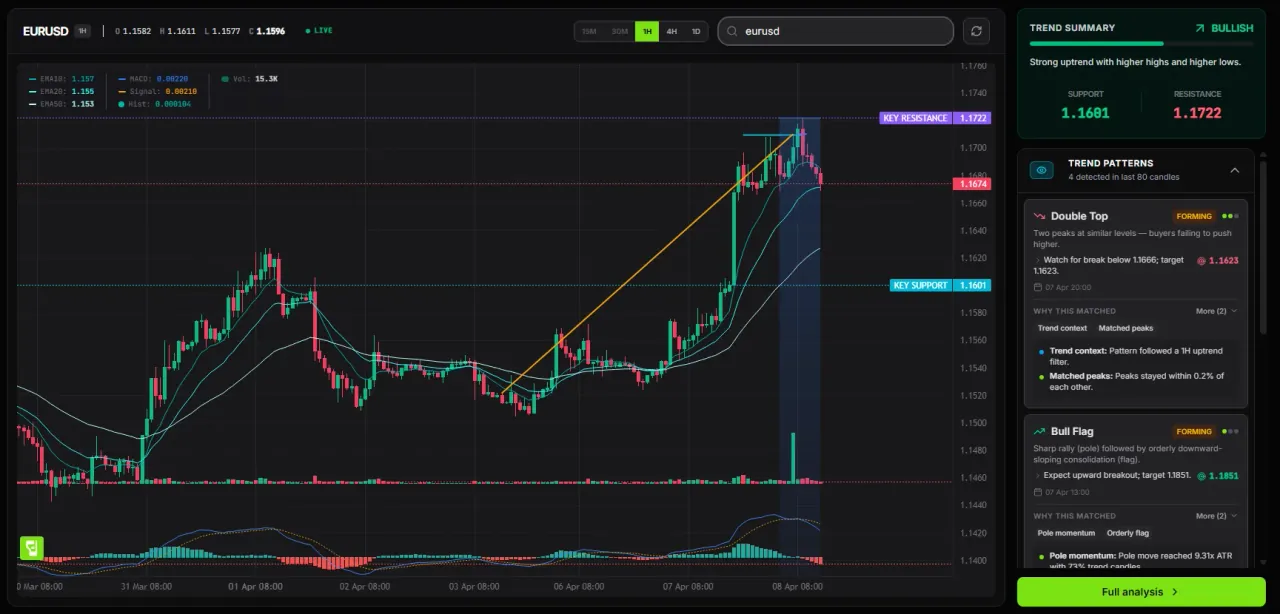
Technical charting & pattern tools
Explore interactive OHLC charts with multiple timeframes, trend context, and pattern highlights across forex, stocks, indices, commodities, and crypto. Visual cues help you study structure—such as uptrends, double tops, and bullish flags—alongside candlestick formations including doji, hammer, bullish engulfing, and morning star. Free to use in your browser for education and research.
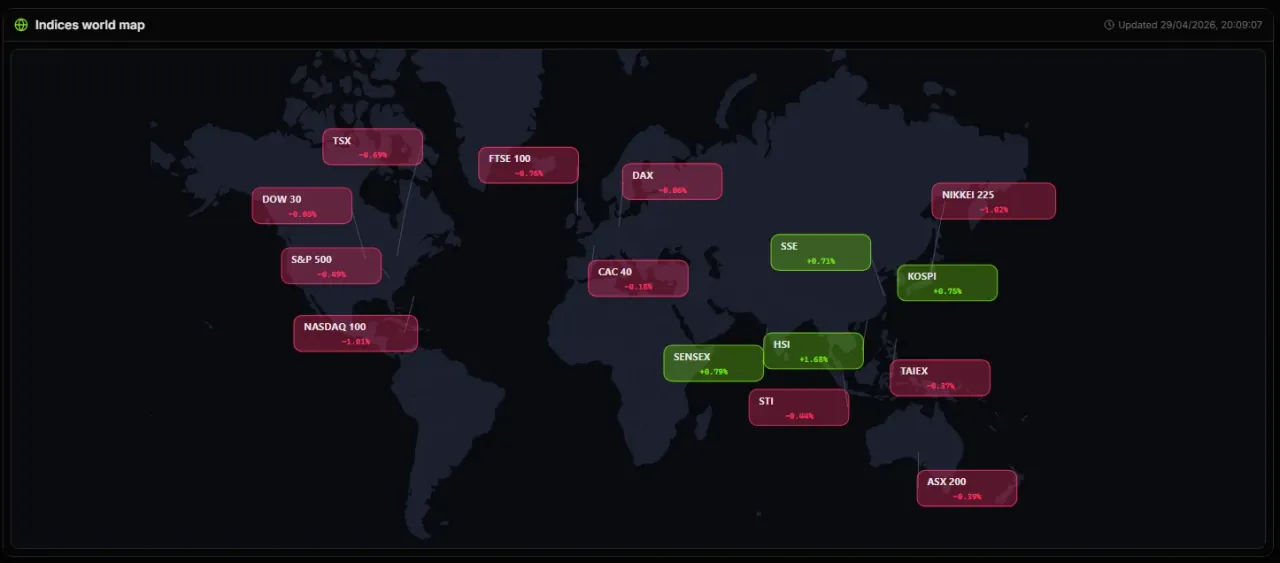
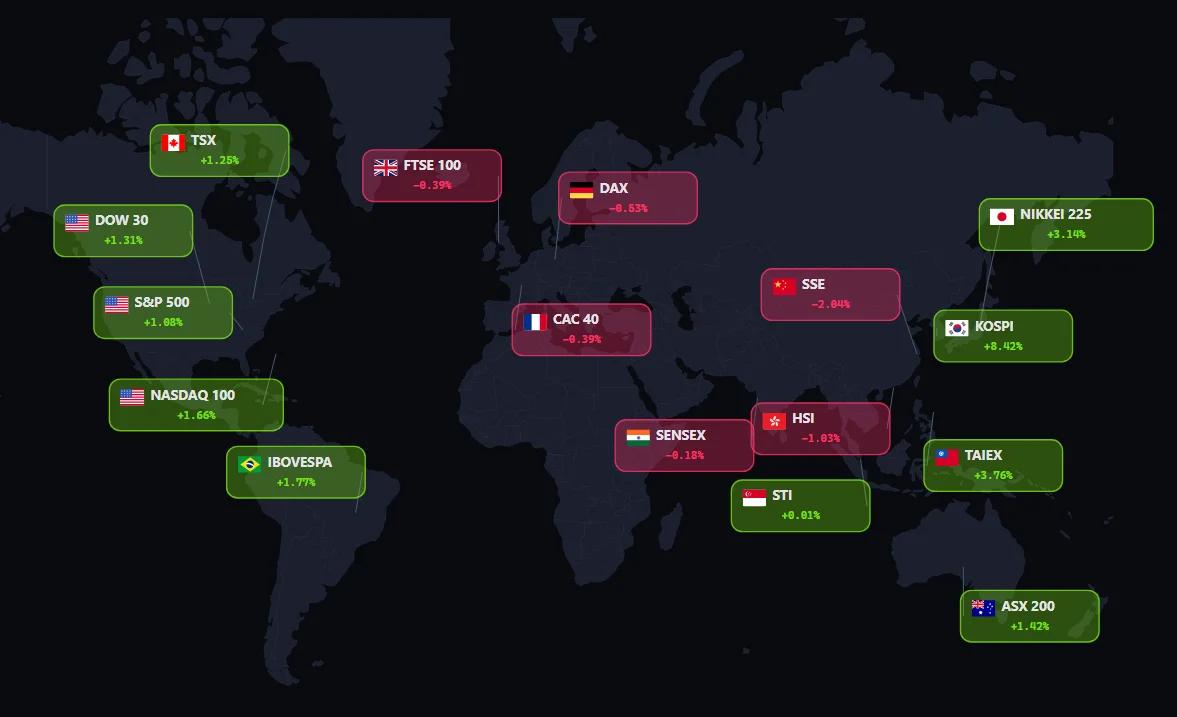
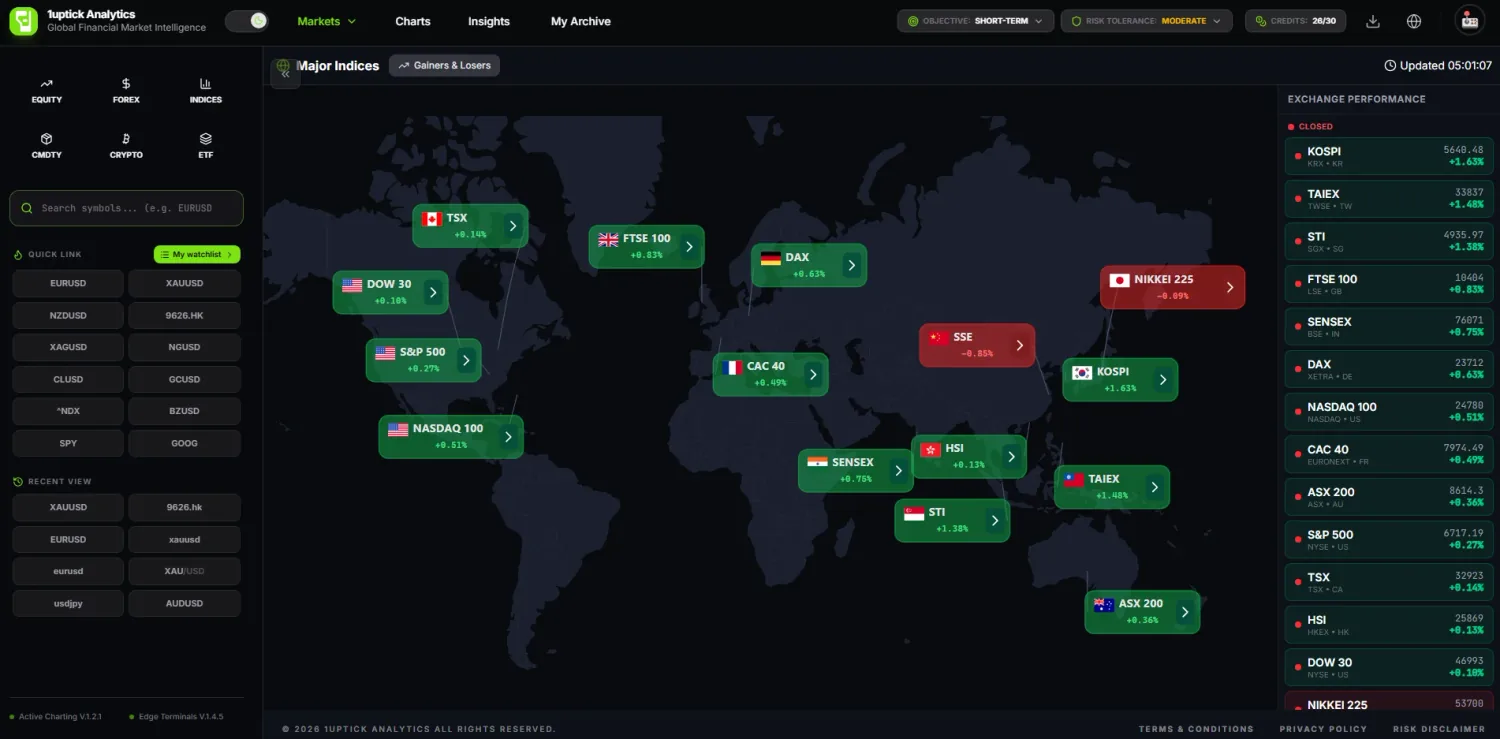
Indices world map
Explore global indices performance on an interactive world map. Open the widget docs for an embeddable version or use it directly in-app.
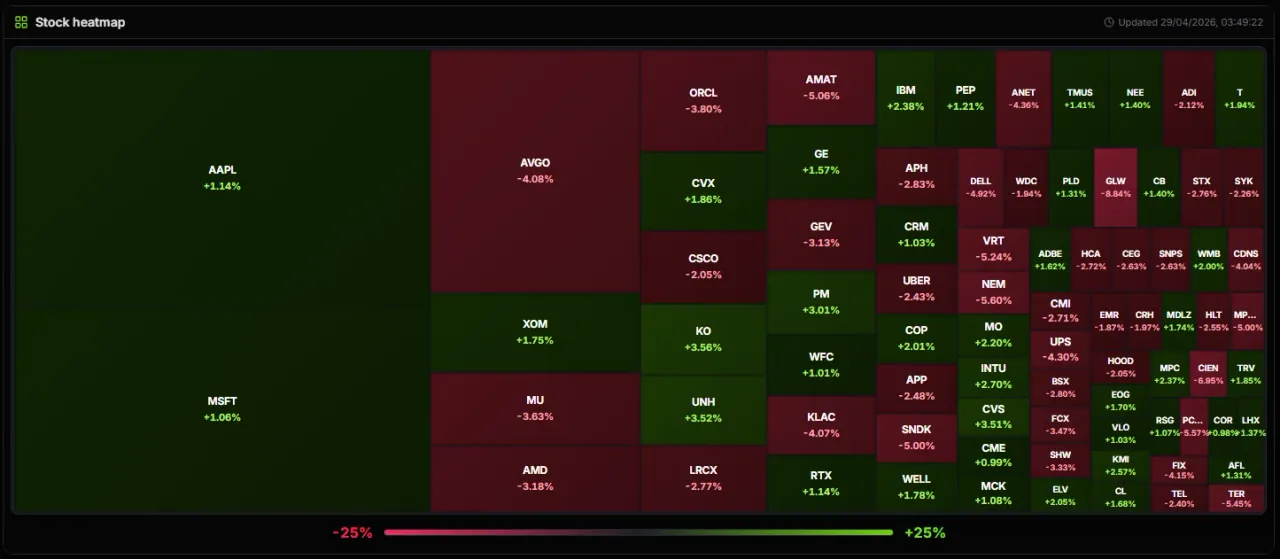
Market performance heatmaps
Scan relative strength and daily moves at a glance with treemap-style heatmaps for stocks, forex, crypto, and commodities—including major indices like the S&P 500, NASDAQ 100, Nikkei 225, and Hang Seng (HSI). Investors can use them to read market breadth, compare sectors and themes, and see where strength or weakness is clustering—so it is easier to shortlist ideas and focus follow-up research. Free, browser-based tools for research and education—spot leaders, laggards, and category structure in seconds.
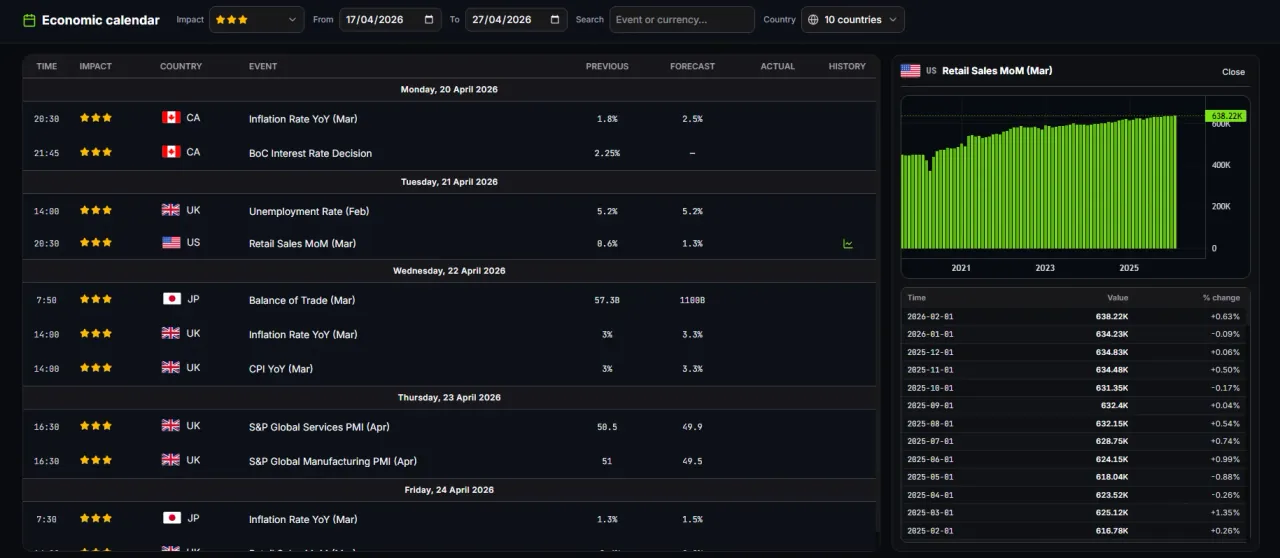
Economic calendar
Track high-impact macro releases with scheduled dates, consensus forecasts, and prior readings—filter by country and impact so you can plan around volatility. Free in your browser for research and education.
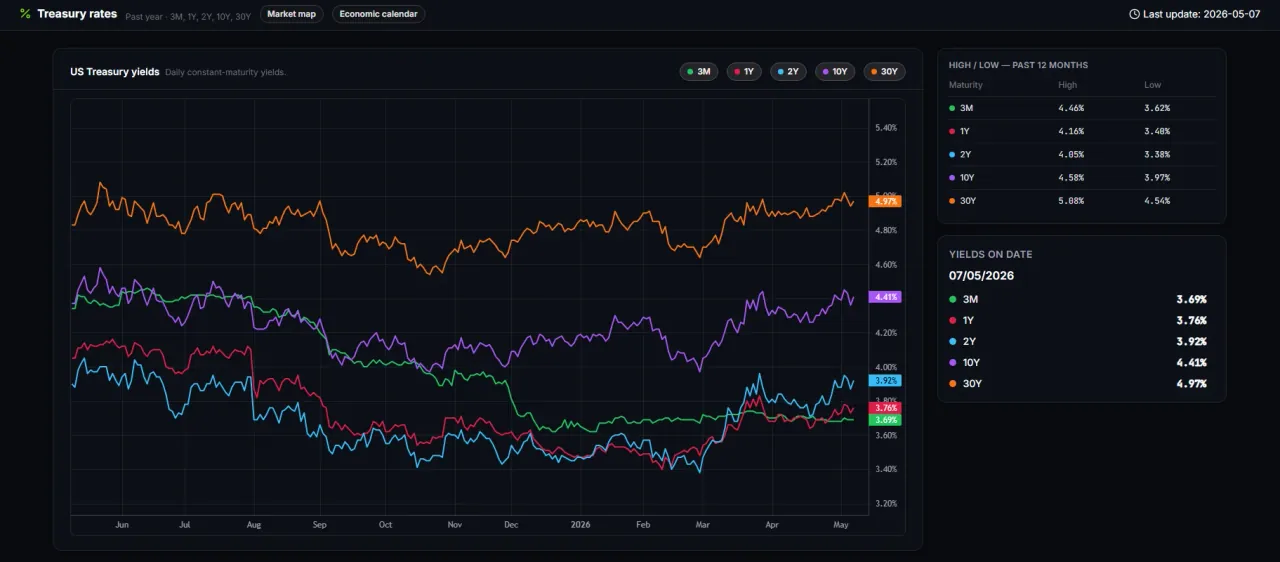
Treasury rates
Track US Treasury yields across maturities with an interactive chart, historical ranges, and crosshair details.
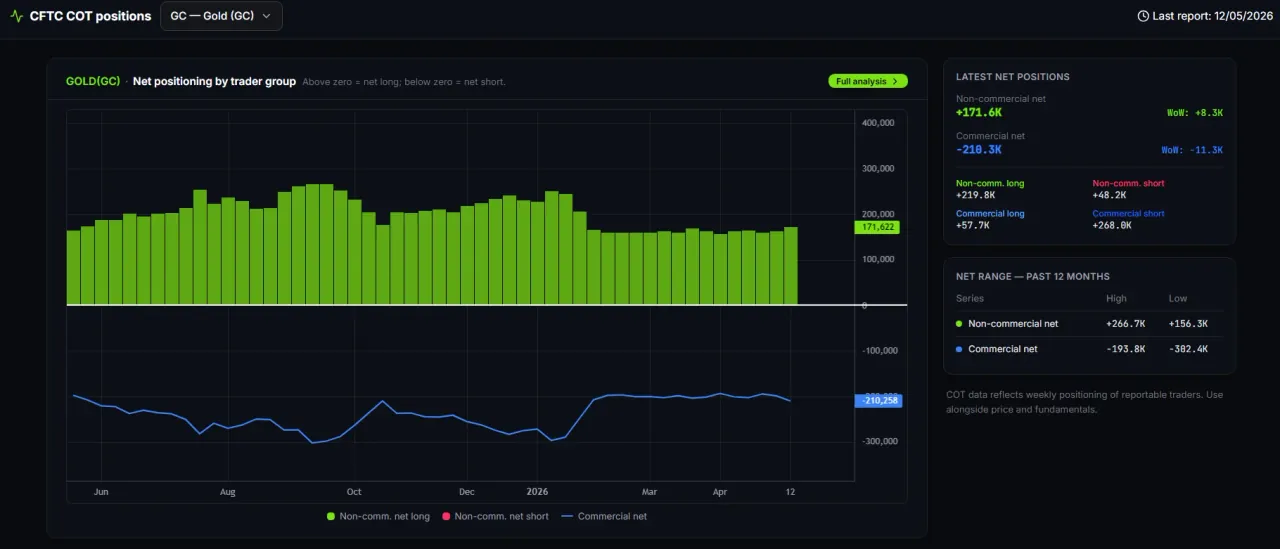
CFTC COT positions
Weekly Commitment of Traders (COT) report: commercial and non-commercial long, short, and net contracts for futures. Interactive chart, contract picker, and 12-month history—free for research and education.
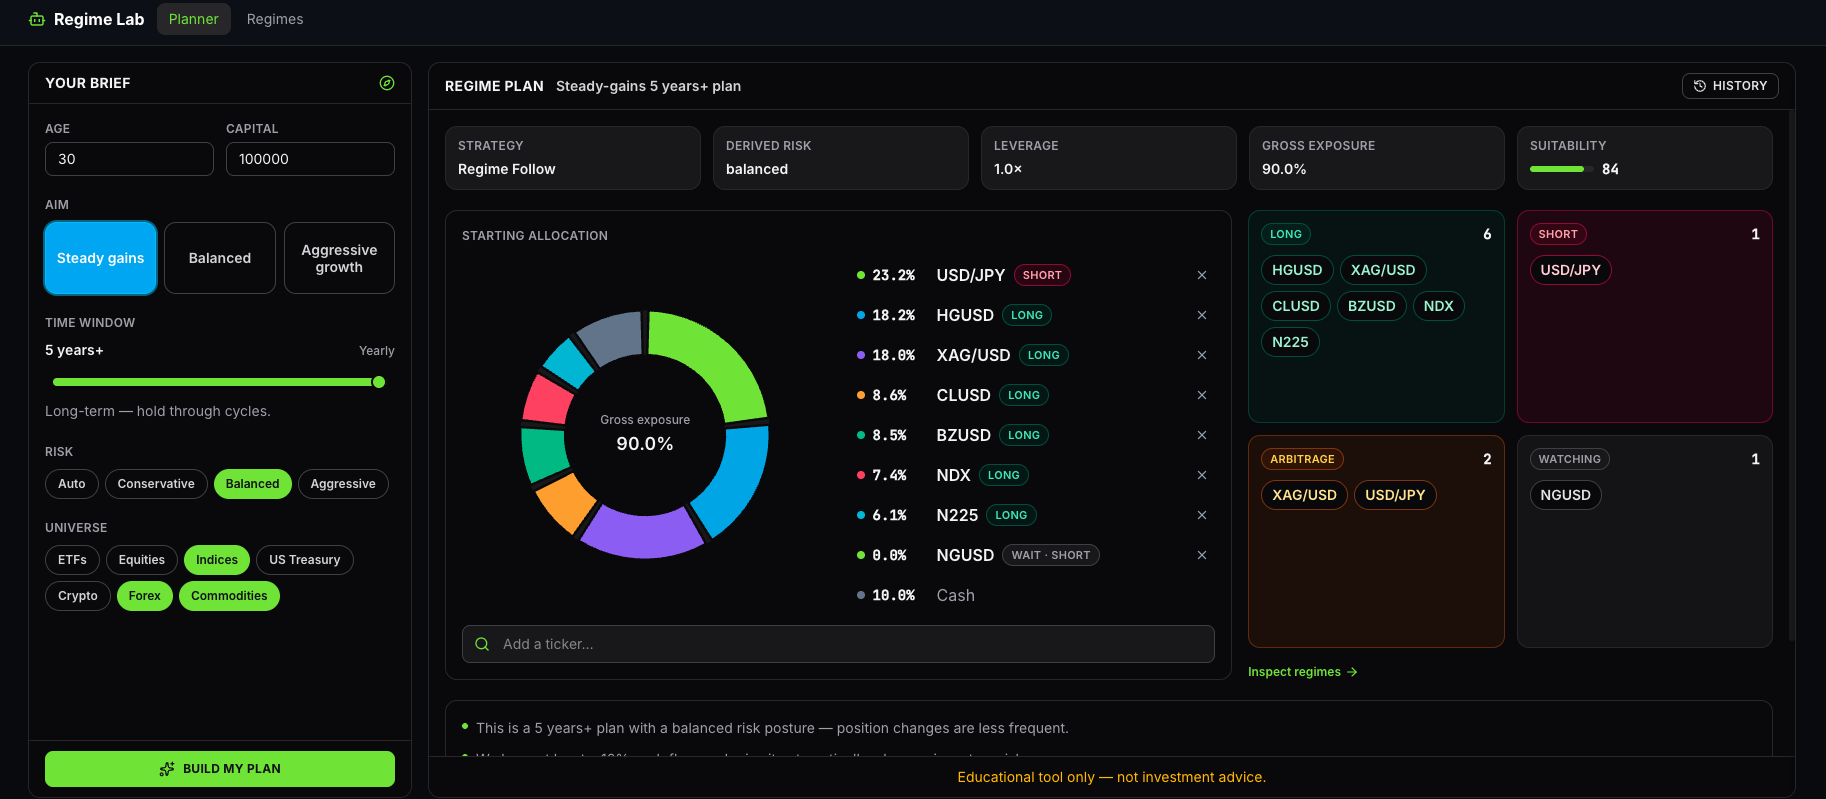
Regime Lab
Turn a brief—aim, horizon, risk, and universe—into a starting book with long, short, and relative-value sleeves. Then monitor HMM regimes, holdings, and marks as the plan evolves. Free educational tools powered by 1uptick market data.
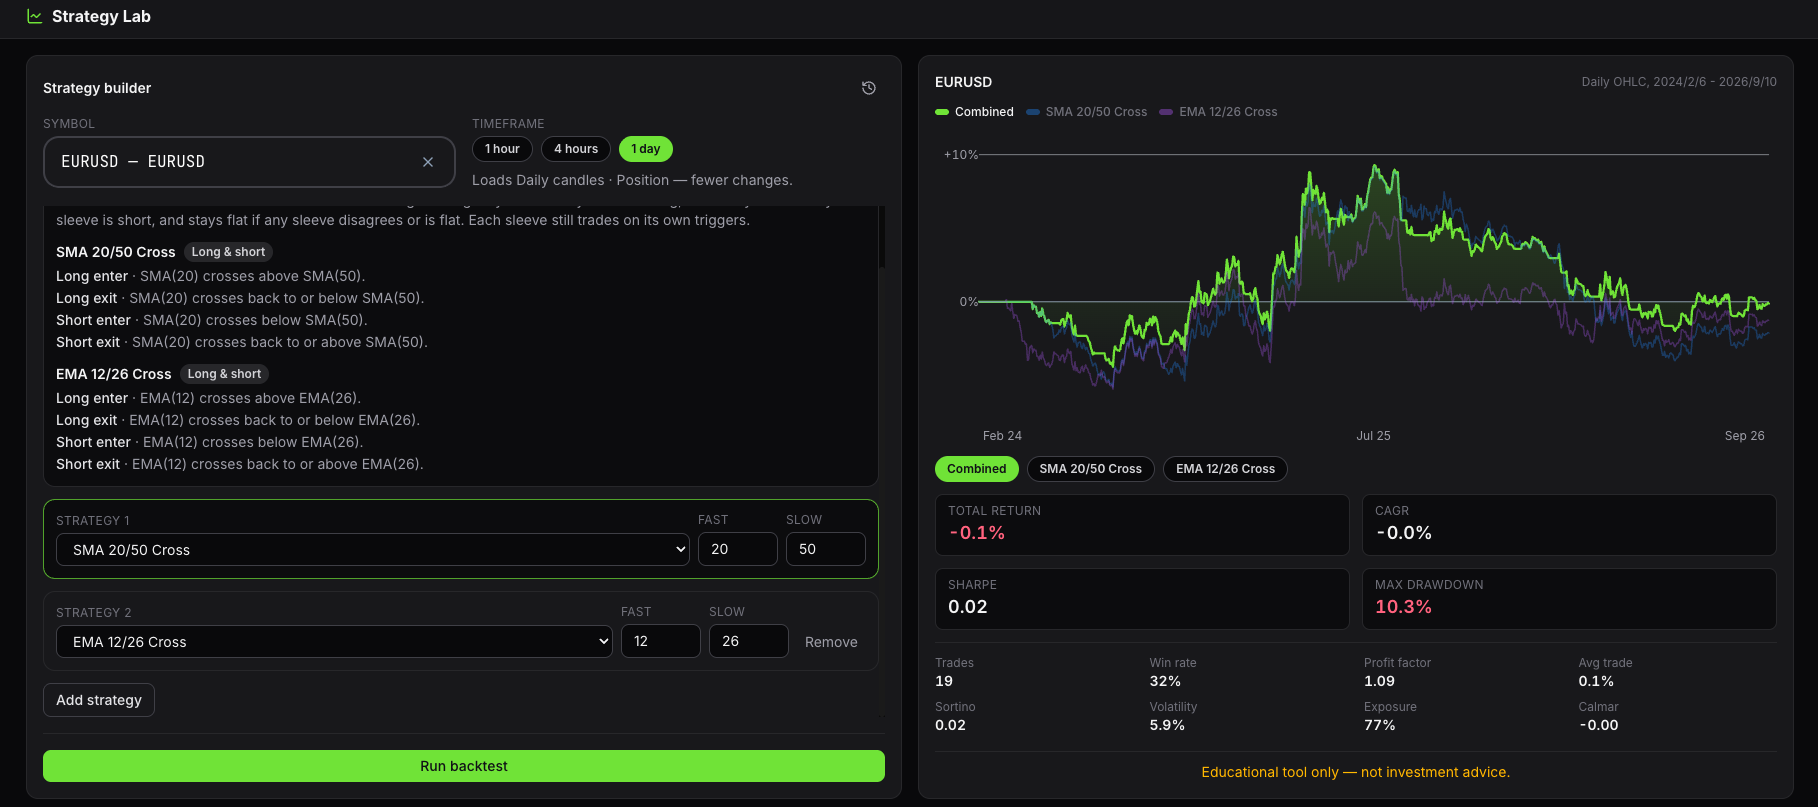
Strategy Lab
Build and stack rule-based sleeves on any symbol, run a combined backtest, and read the equity curve with return, drawdown, and risk stats. Free educational tools powered by 1uptick market data.
Financial market analysis
Free, browser-based tools for investment research and market education—charting, heatmaps, economic calendar, and more
Technical charting & pattern tools
Explore interactive OHLC charts with multiple timeframes, trend context, and pattern highlights across forex, stocks, indices, commodities, and crypto. Visual cues help you study structure—such as uptrends, double tops, and bullish flags—alongside candlestick formations including doji, hammer, bullish engulfing, and morning star. Free to use in your browser for education and research.
Indices world map
Explore global indices performance on an interactive world map. Open the widget docs for an embeddable version or use it directly in-app.
Market performance heatmaps
Scan relative strength and daily moves at a glance with treemap-style heatmaps for stocks, forex, crypto, and commodities—including major indices like the S&P 500, NASDAQ 100, Nikkei 225, and Hang Seng (HSI). Investors can use them to read market breadth, compare sectors and themes, and see where strength or weakness is clustering—so it is easier to shortlist ideas and focus follow-up research. Free, browser-based tools for research and education—spot leaders, laggards, and category structure in seconds.
Economic calendar
Track high-impact macro releases with scheduled dates, consensus forecasts, and prior readings—filter by country and impact so you can plan around volatility. Free in your browser for research and education.
Treasury rates
Track US Treasury yields across maturities with an interactive chart, historical ranges, and crosshair details.
CFTC COT positions
Weekly Commitment of Traders (COT) report: commercial and non-commercial long, short, and net contracts for futures. Interactive chart, contract picker, and 12-month history—free for research and education.
Regime Lab
Turn a brief—aim, horizon, risk, and universe—into a starting book with long, short, and relative-value sleeves. Then monitor HMM regimes, holdings, and marks as the plan evolves. Free educational tools powered by 1uptick market data.
Strategy Lab
Build and stack rule-based sleeves on any symbol, run a combined backtest, and read the equity curve with return, drawdown, and risk stats. Free educational tools powered by 1uptick market data.

Choose Your Plan
Free
FreeGet Started
- Full access to Market Snapshot
- Full access to Charting tools
- Basic Edge Terminal analysis
No credit card required
Sign Up FreeBasic
US$ 19/monthExplorer Plan
- Full access to Market Snapshot
- Full access to Charting tools
- Advanced Edge Terminal analysis
Token usage is based on actual AI cost — full analysis, MarketSnap, coaching, and translations each consume tokens. Subscription tokens refresh at the start of each billing cycle. Unused tokens do not roll over.
Need more tokens? Purchase additional token packs. here.
We combine up-to-date market data and news to produce structured, ticker-level research tailored to your investment objective and risk tolerance.
Frequently Asked Questions
Everything you need to know about 1uptick AI and how it works.